Category: 2016 Election

The Visual Rhetoric of Data Part 2: Political Maps and Infographics

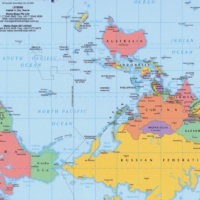
“…maps give us, reality, a reality that exceeds our reach, our vision, the span of our days, a reality we achieve in no other way. ” So wrote Denis Wood when discussing how maps construct our reality (Wood, 2016). Maps are tools for knowing the world but also, ways of knowing it. They communicate what […]

Comments Off on The Visual Rhetoric of Data Part 2: Political Maps and Infographics Leave a Response

A New Tool Lets You Visualize the Spread of Fake News

I came across this post at ProfHacker a while back about a new tool called Hoaxy. The tool allows you to visualize the spread of claims and fact checks online. Of course, the biggest potential use could be in visualizing the spread of fake news. The writer at ProfHacker quoted the FAQ on the website, Hoaxy […]

Comments Off on A New Tool Lets You Visualize the Spread of Fake News Leave a Response